
29/07 & 05/08 2020 - Webinars - Earth Surface Analysis over Space and Time; integrating programming with Google Earth Engine (GEE) and R
Incipit - share through an informal series of webinars some recent real-case scenarios from my (Francesco Pirotti) research - mainly related to VAIA storm effects - where tasks related to spatial-data were solved by integrating GIS methods with scripting in Google Earth Engine GEE and R.
Why? programming/scripting is increasingly important - researchers, but also master students, should be able to use these tools or at least know where to start for self-learning. GEE uses Javascript, and R its own syntax, but principles are the same across languages. Integrating GEE and R in your workflow can boost your productivity and open new scenarios with spatial data, hopefully increasing your skills in problem-solving.
Who is it for? For any researcher/student out there that fiddles with GIS, is curious about the potential of programming and wants to integrate more advanced tools in her/his research.
How does it work? You can simply sit back and relax and follow the webinar, interacting with constructive questions/comments, or you can also follow the various steps yourself with the data provided*. In the latter case “we brake for nobody” - cit. a very old movie - in the sense that this is a webinar not a lecture so only limited support to single problems will be provided, and very much on the whim of the lecturer (me)
*Sign-up to GEE @ code.earthengine.google.com + Download&install R + RStudio - if you are already knowledgeable in R then proceed to install the packages “raster”+”lwgeom”+”sf”+”mapview”
All seminars are open (moderated) and accessible via zoom @ https://unipd.zoom.us/j/98756930077
For now there will be two dates:
29th July 2020 - 9:00 - 13:00
Preparing spatial data for predictive modeling of damages of forest wind-throw from extreme weather.
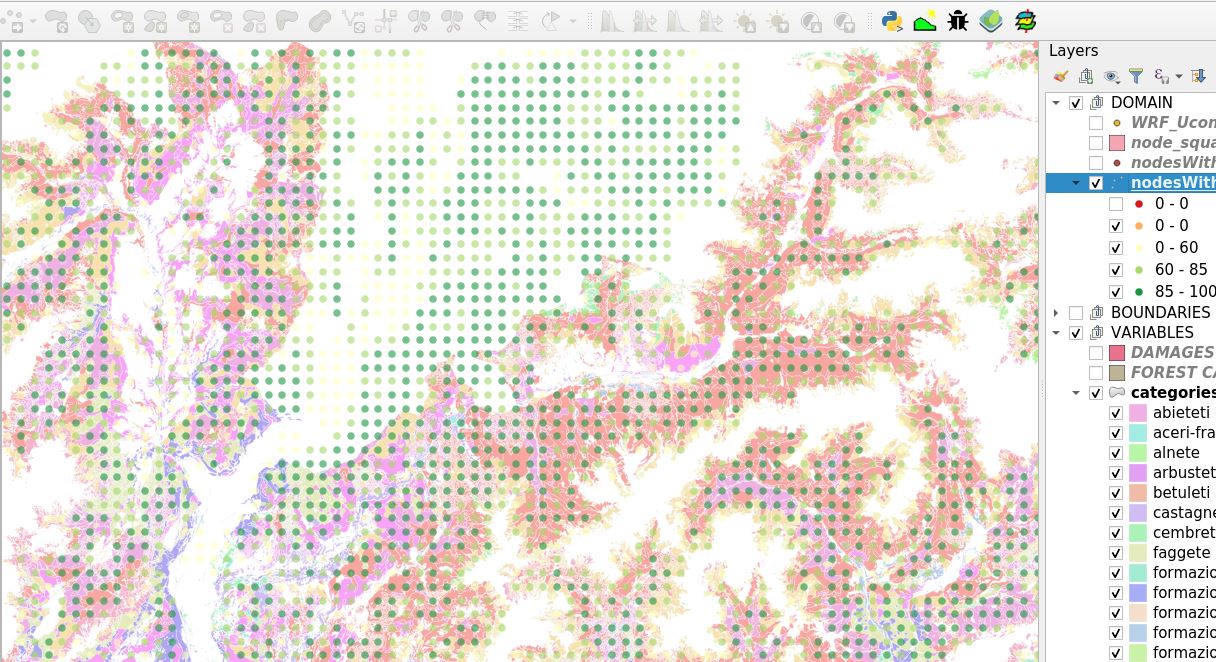
In this collaboration with the University of Connecticut, information on forest cover, forest categories, damages, etc was aggregated at nodes of a regular grid that will be used for training a model.
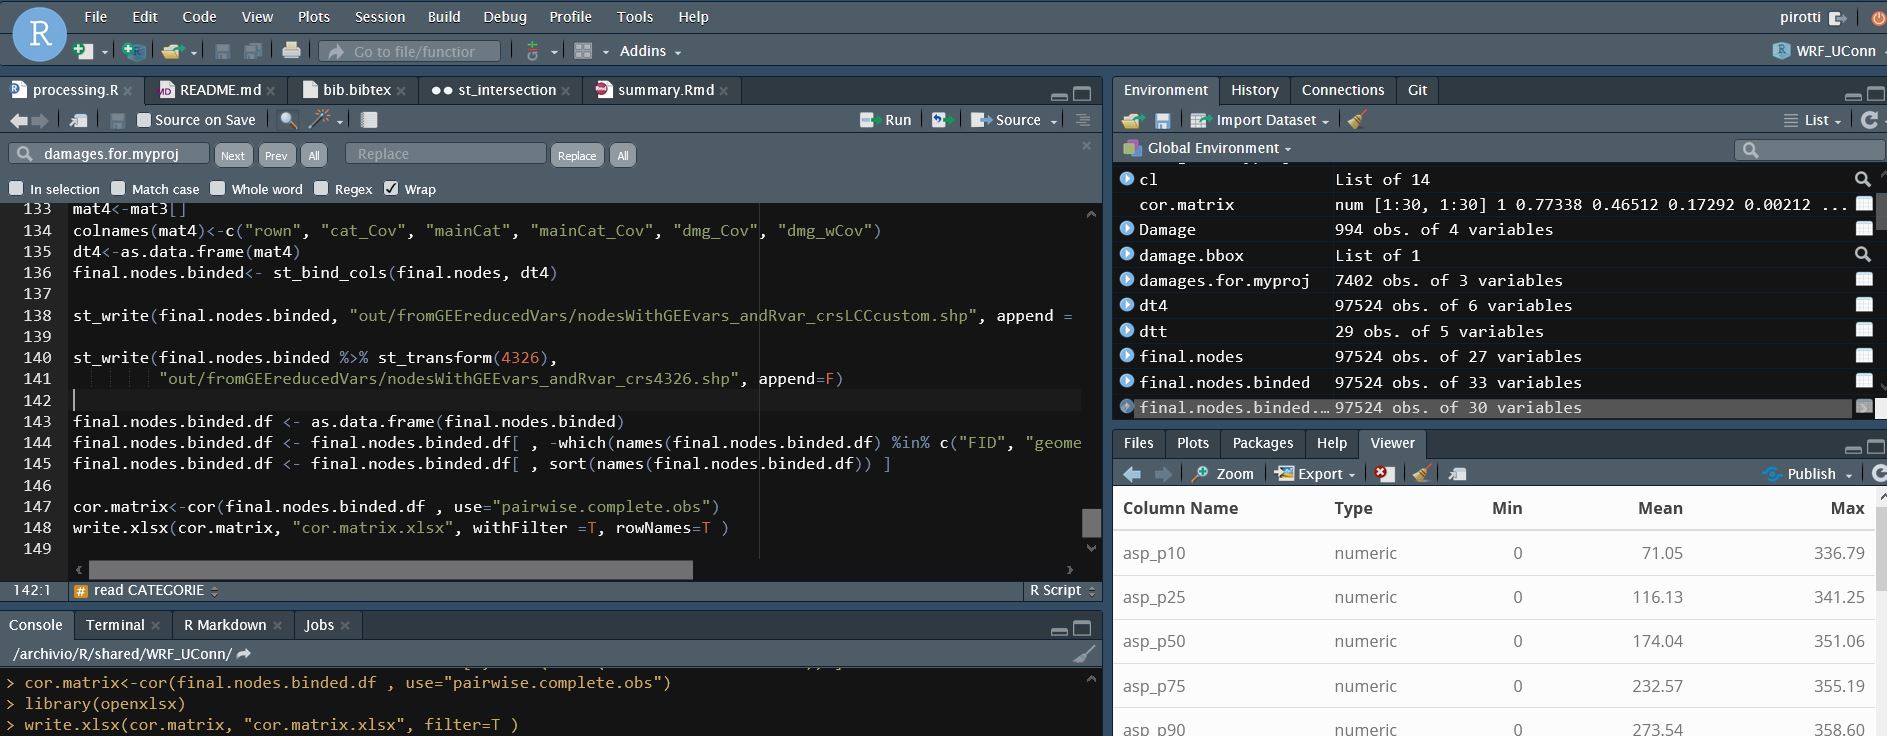
We will talk about: models, importing data to GEE, cleaning polygon topology with QGIS, the problems of dirty topology, the problem of defining a regular grid over a ellipsoid, coordinate reference systems, creating a custom coordinate reference system, geoprocessing (intersections, self intersections) with R, aggregating spatial data, weighted aggregations, statistical tests for correlation, correlation does not imply causation, and a quick mention of GITHUB for syncing / sharing / backing up your code.
- Material - If you want to follow along then get your hands on this material:
- damage areas from VAIA available from open data (see paper by Forzieri, G.; Pecchi, M.; ……. Pirotti F.; et al. A spatially explicit database of wind disturbances in European forests over the period 2000 - 2018. Earth Syst. Sci. Data 2020, 12, 257–276.) OR directly accessible from the WFS service of the Regione Veneto (WFS link https://idt2-geoserver.regione.veneto.it/geoserver/ows - filter for “schianti”)
- Any regular grid that you create yourself over an area. I suggest a 100 x 100 grid with 1 km resolution over the damaged area.
5th August 2020 - 9:00 - 13:00
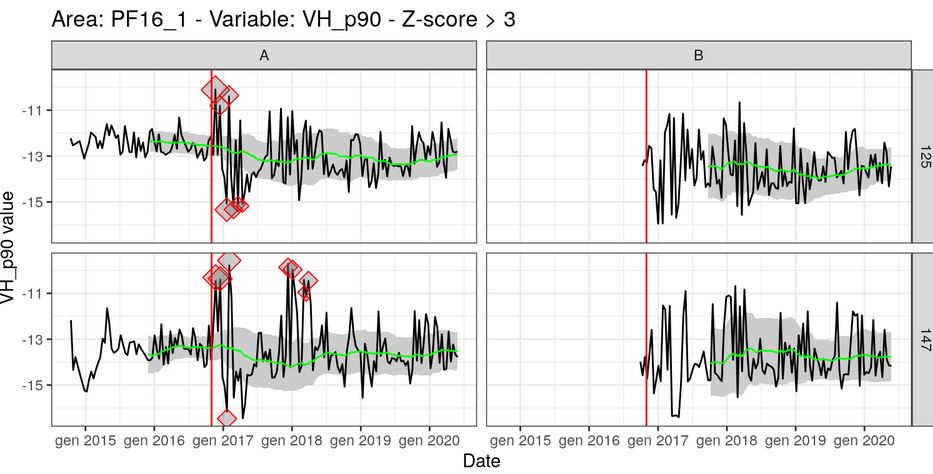
Analyzing Sentinel 1 RADAR backscatter data over time to assess its ability to identify disturbances such as VAIA windthrow.
From work for a thesis that targeted detection of disturbance of fires, we will plot information of RADAR backscatter inside damaged areas to see if pre vs. post event signal is significantly different or not.
We will talk about: RADAR backscatter signal, polarimetry, Sentinel-1 data from GEE, integrating third-party functions in GEE, map-reduce functions to aggregate data over areas in GEE, exporting data in GEE, time-series analysis in R with standardized Z-score, plotting your data for integration in articles.
- Material - If you want to follow along then get your hands on this material:
- damage areas from VAIA available from open data (see paper by Forzieri, G.; Pecchi, M.; ……. Pirotti F.; et al. A spatially explicit database of wind disturbances in European forests over the period 2000 - 2018. Earth Syst. Sci. Data 2020, 12, 257–276.)
- OR directly accessible from the WFS service of the Regione Veneto (WFS link https://idt2-geoserver.regione.veneto.it/geoserver/ows - filter for “schianti”)
- OR any area which had a disturbance (between now and the start of Sentinel-1 availability - ) over vegetation which you think might be detected through analysis of time-series of the RADAR data
Some extra references - https://nisar.jpl.nasa.gov/mission/get-to-know-sar/polarimetry/